Smart Mapping your Dreams
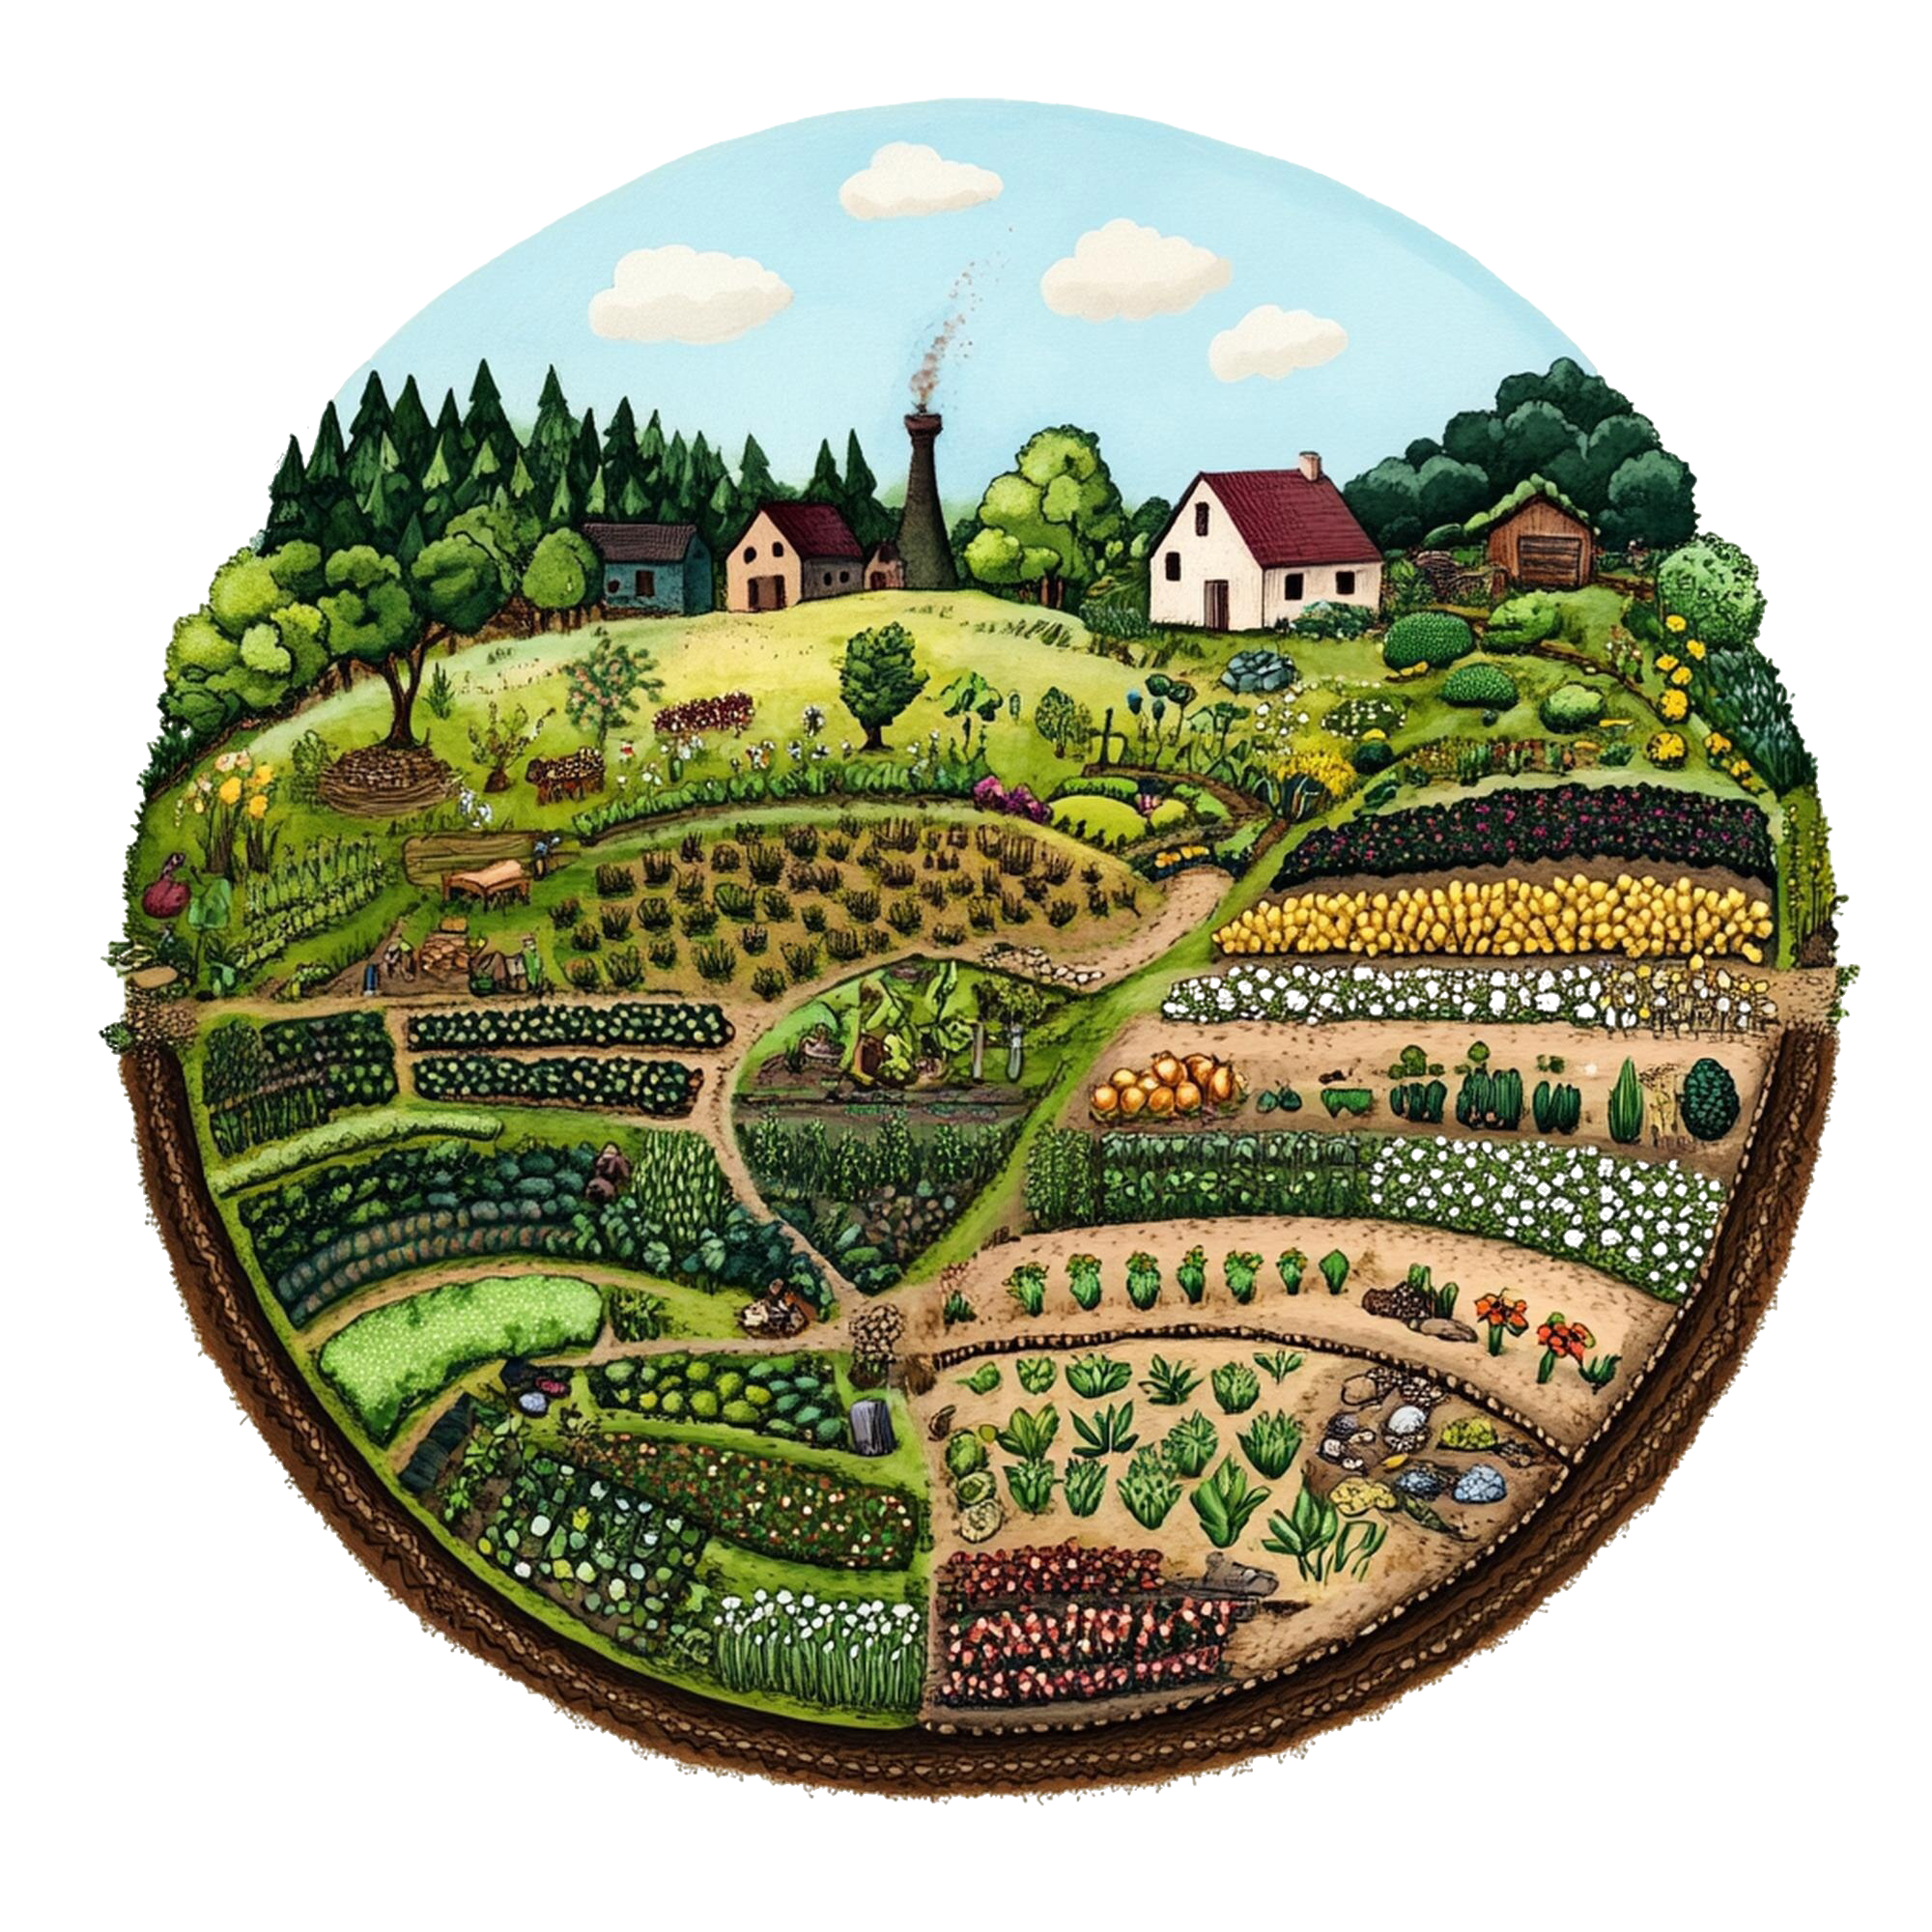
Services
Swales integrates advanced permaculture digital tools, including interactive mapping, environmental data layers (solar, water, soil, wind), and smart design features to help users plan sustainable landscapes, farms, and homes in one seamless platform.
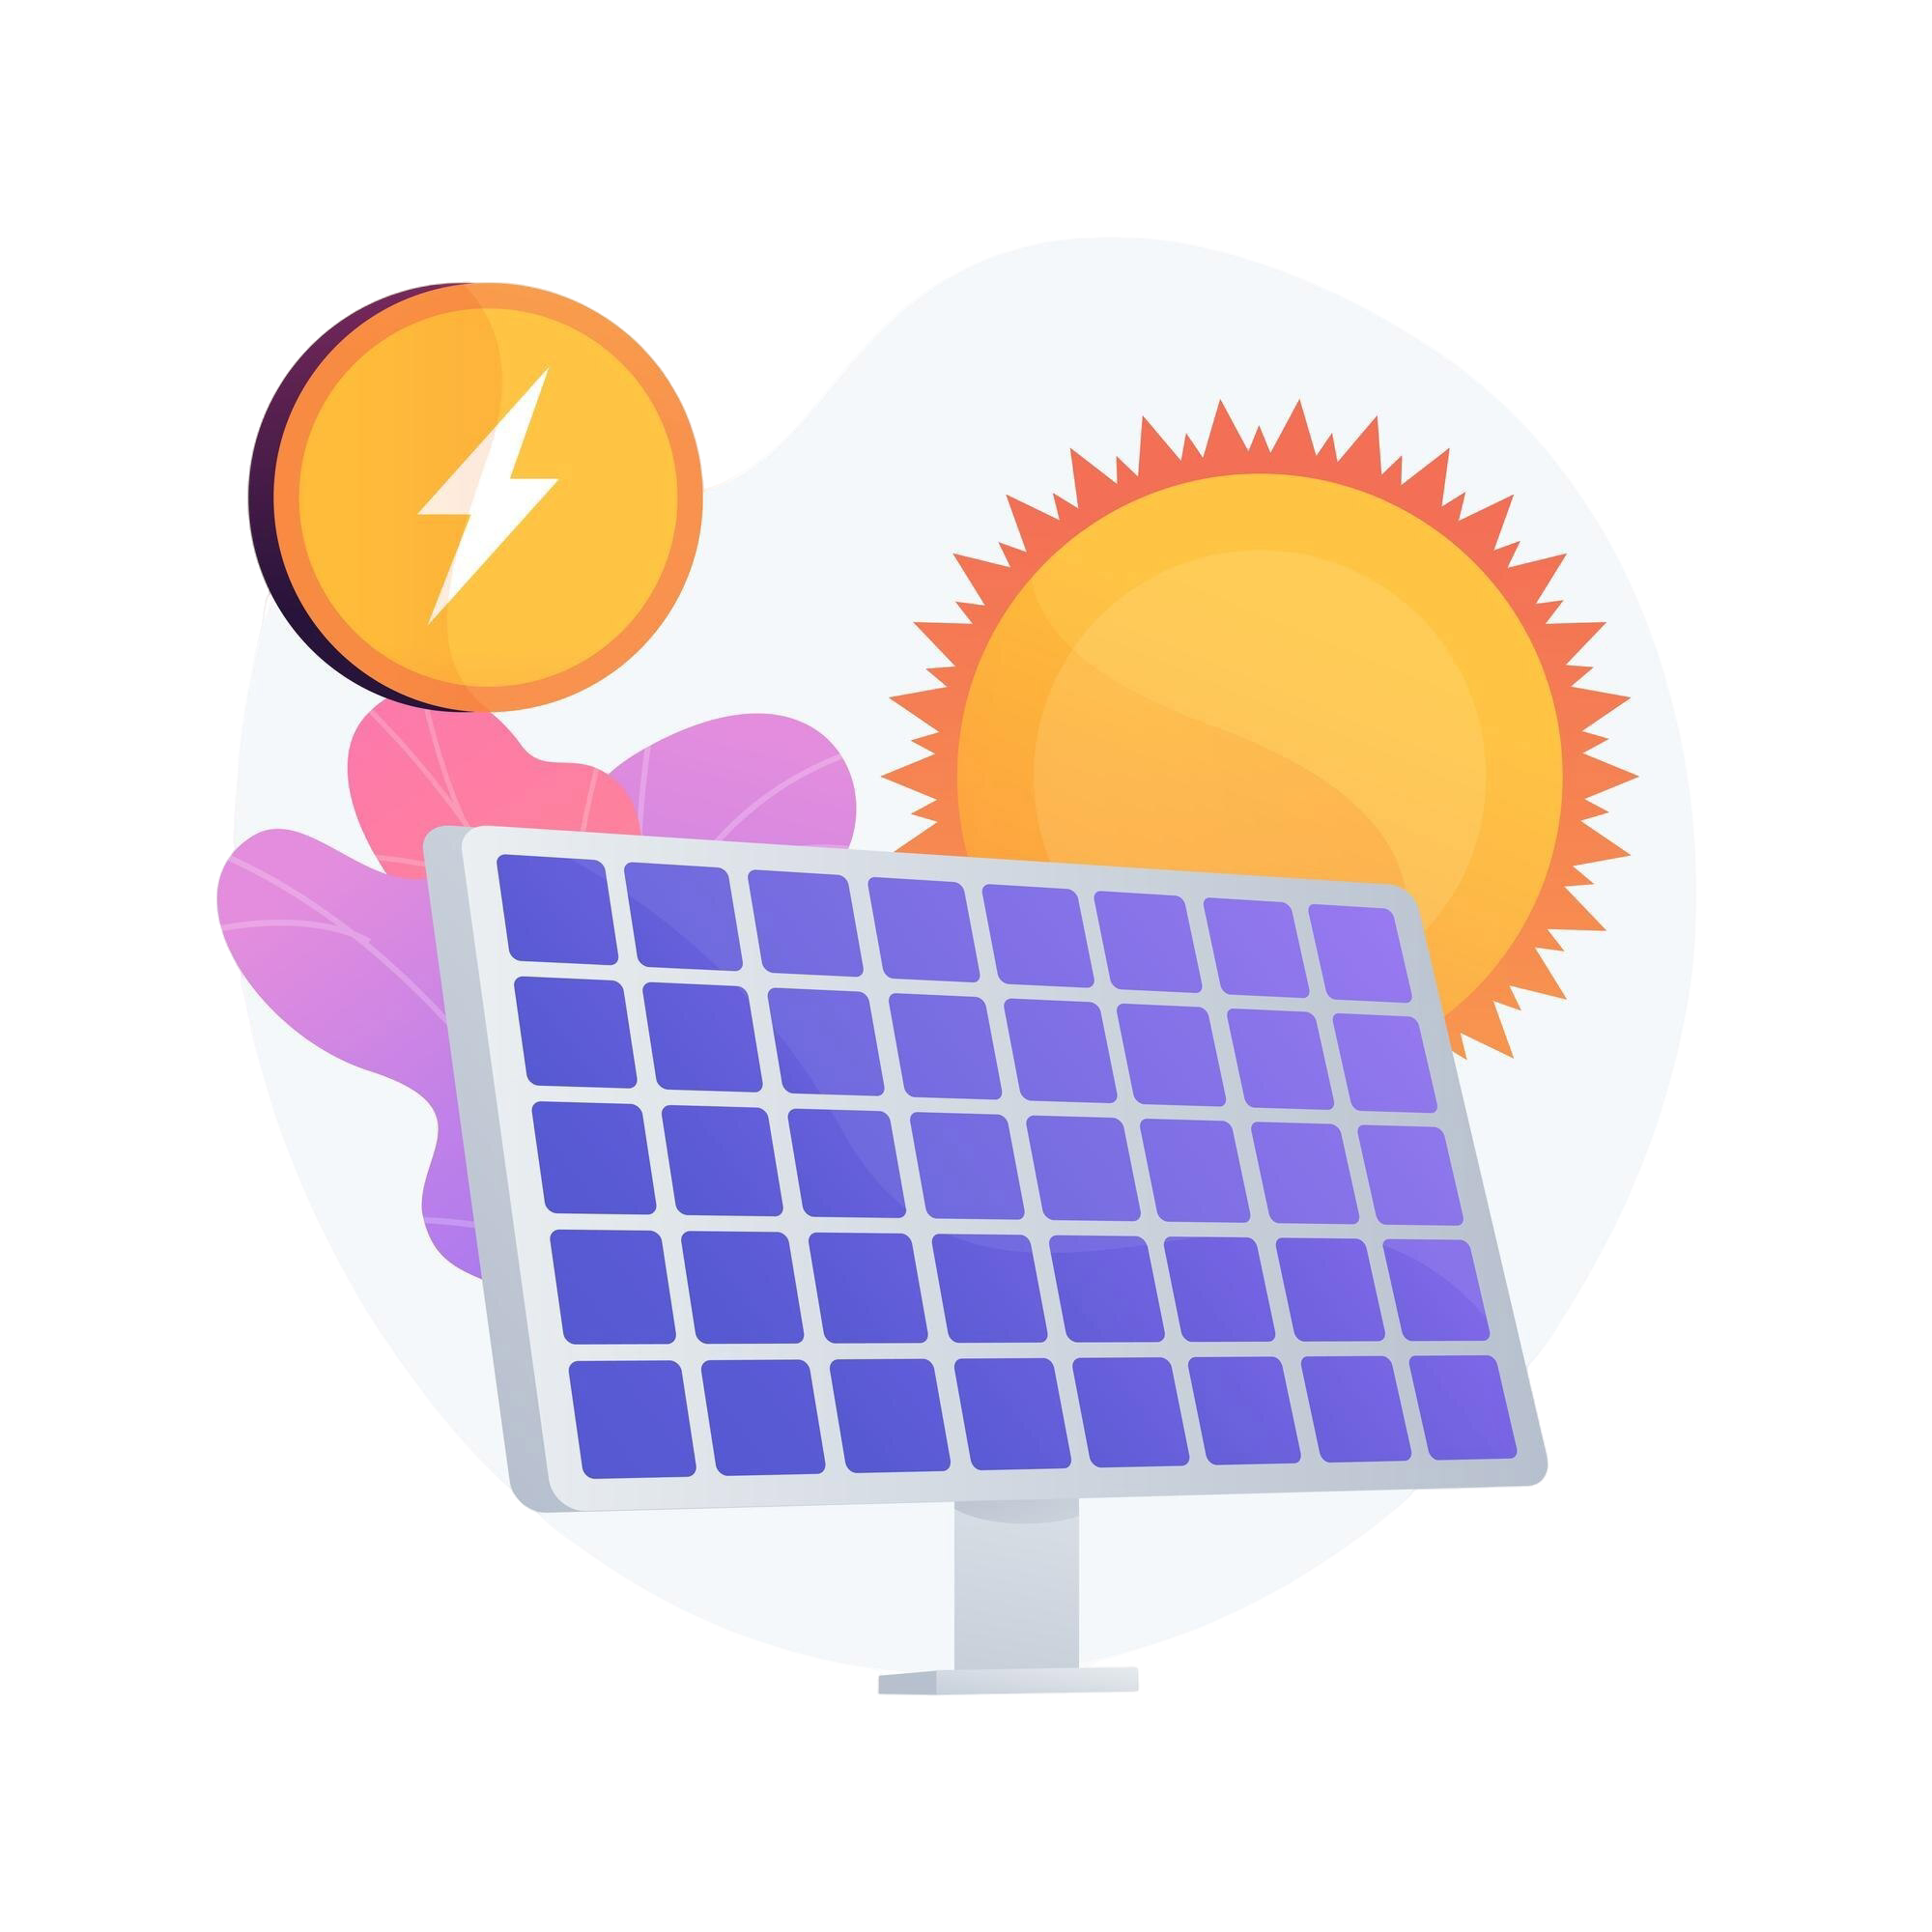
Solar power map
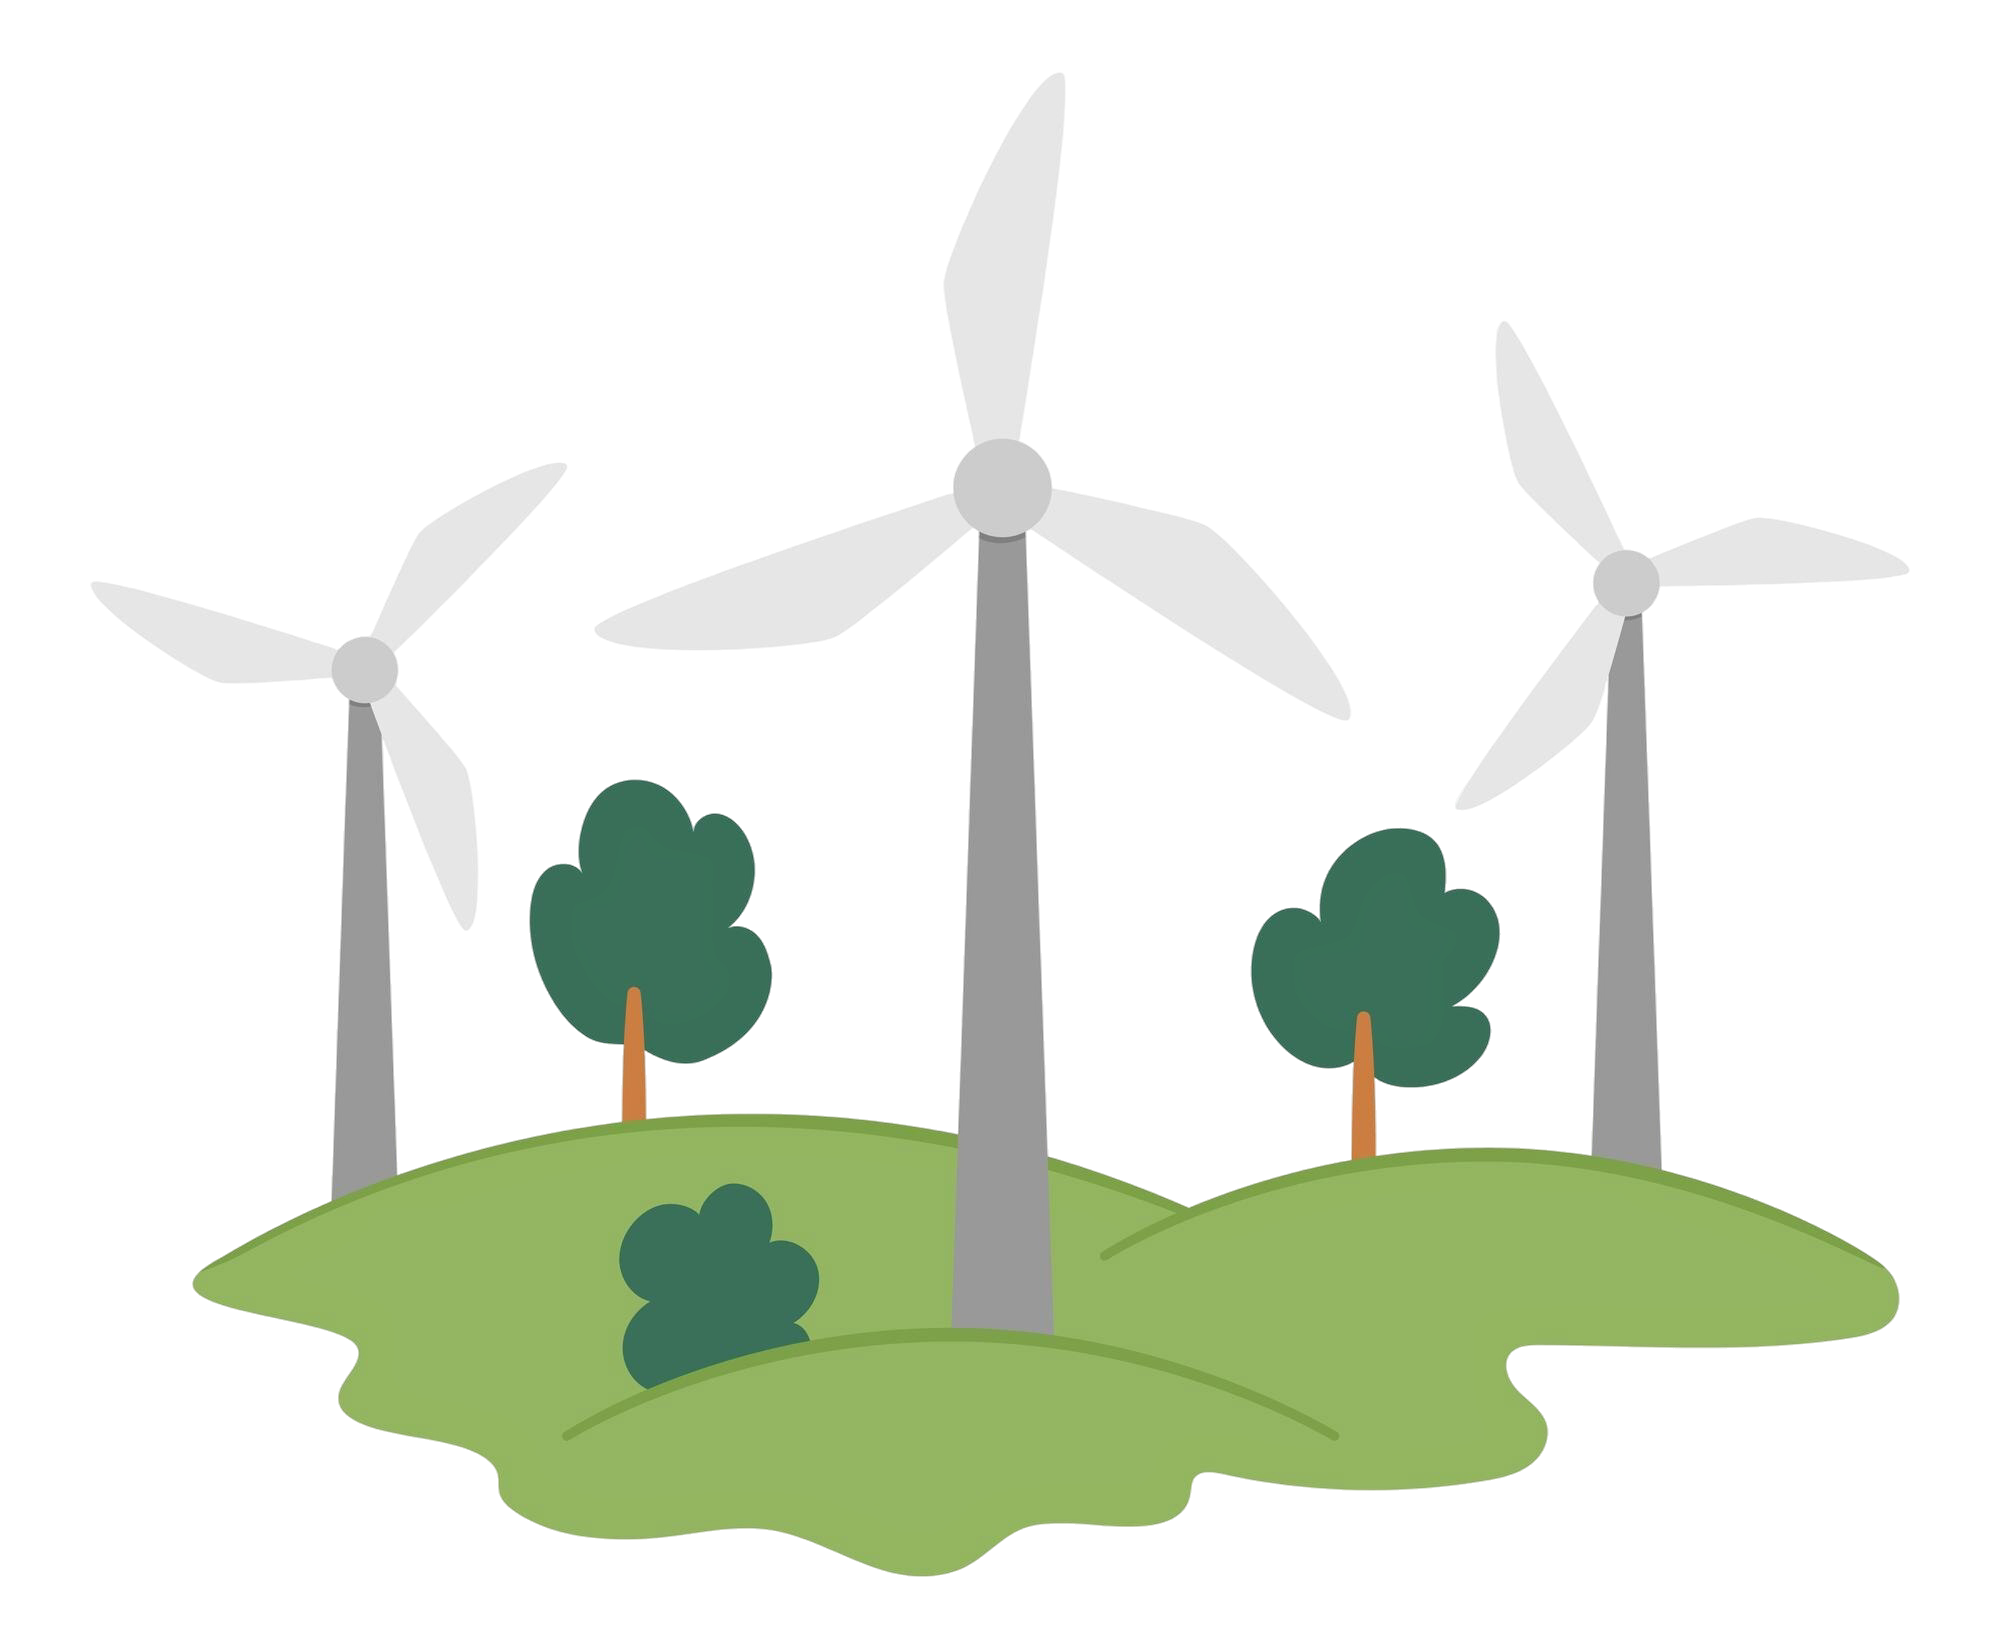
Wind Potential map
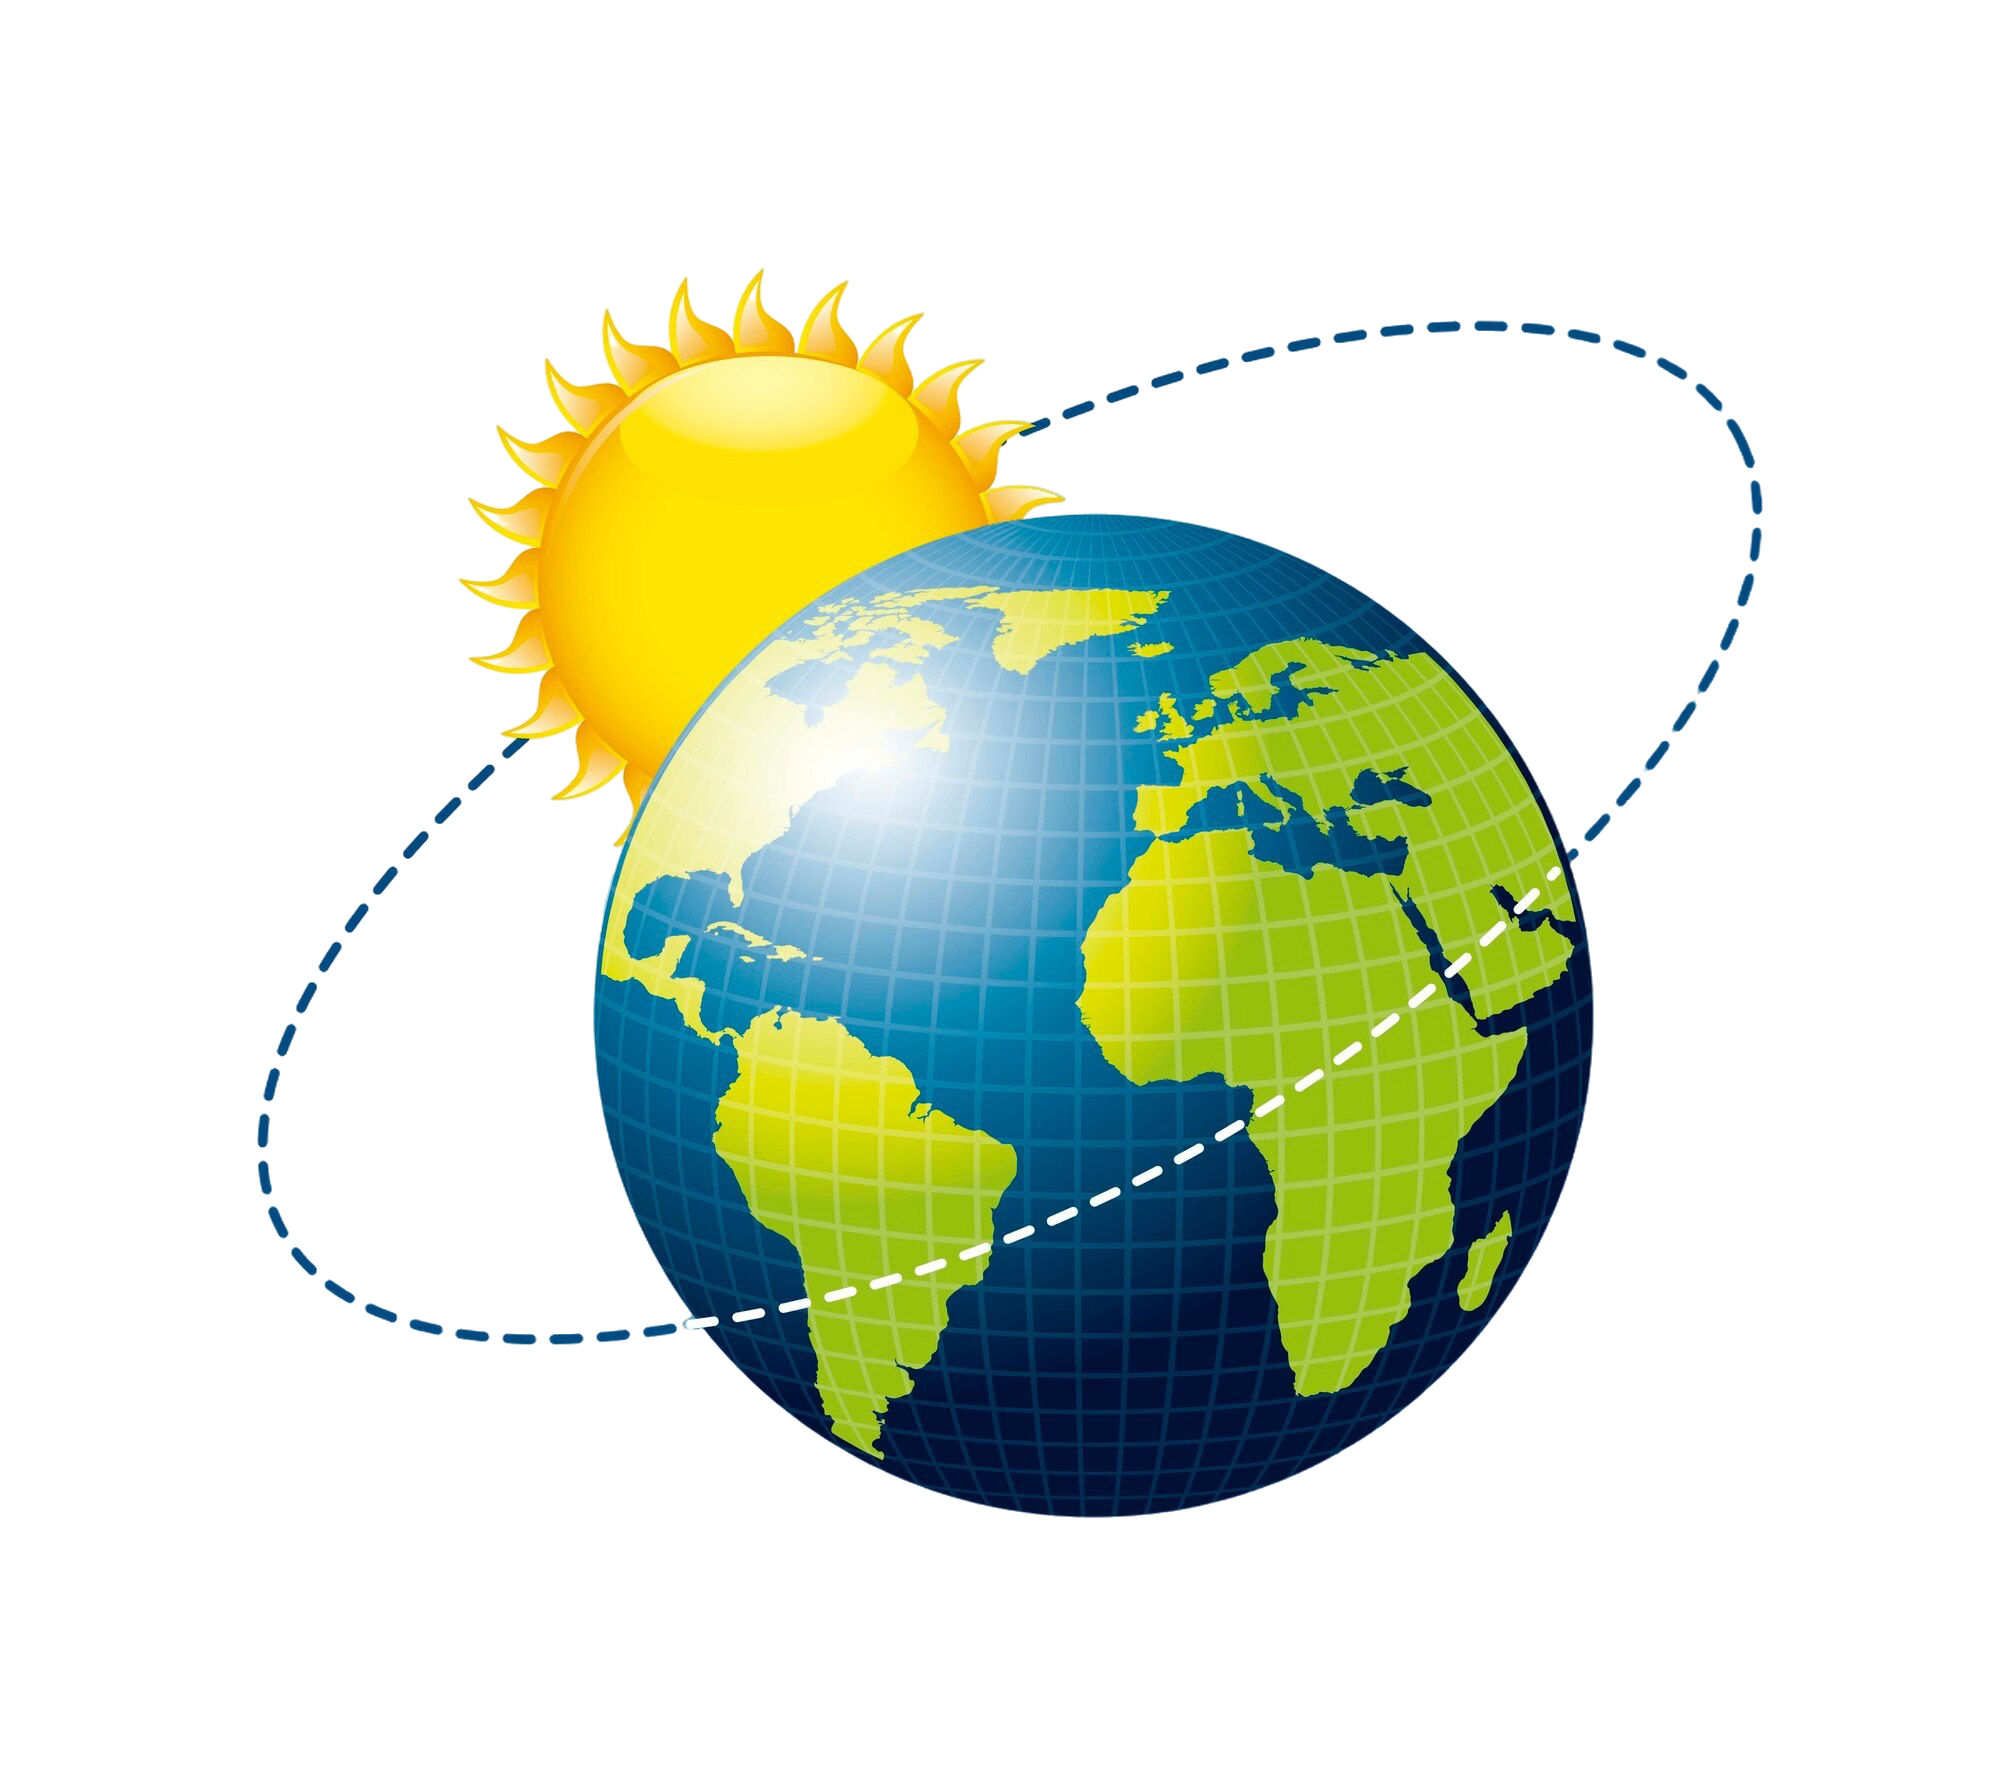
Sun Tracker map
Precipitation map

Soil map
Altitude map
Contour map
Water Stress map
Water flooding map
Weather map

We are happy to hear from you !
Contact us today to learn more about how our digital services can help your grow and succeed, we also will be happy to answer any question.
Contact Us
How it works
Discover the true energy potential of your land with Swales' interactive solar power map. Analyse sunlight intensity and solar exposure based on your exact location to design smarter homes, farms, and renewable energy systems with confidence.
Solar power map
See the true solar potential of your land in real time
The solar power map transforms your location into a high-resolution solar intelligence system — showing exactly how much energy your site can generate from the sun, based on sun path, solar irradiance, altitude, weather conditions, and seasonal variation.
What you can see
- Solar potential score by location
- Daily and annual energy output estimates
- Seasonal variation in sunlight exposure
- Optimal zones for solar panel placement
- Site-specific solar reliability and intensity
Why it matters
- Design efficient renewable energy systems
- Position solar panels for maximum output
- Plan off-grid homes and farms
- Reduce long-term energy costs
- Build energy-resilient landscapes
Suitable for
Smarter energy starts with better data. With Swales.app, you don't guess your solar potential — you see it clearly, directly on your land.
Use our advanced wind power map to understand wind direction, speed, and energy potential for any location. Swales helps you make better decisions for natural ventilation, wind protection, and renewable energy planning.
Wind potential map
Understand the wind power hidden in your land
The wind potential map reveals how wind moves across your exact location and how much usable energy or environmental force it can provide — combining real-time wind speed data, elevation, terrain exposure, and location-specific climate patterns.
What you can see
- Wind speed and consistency at your location
- Wind energy density (W/m²)
- Stability and reliability of wind supply
- Recommended turbine capacity by land use
- Hub height performance (residential to industrial)
- Estimated annual energy yield
Why it matters
- Design wind turbine systems
- Plan off-grid or hybrid energy setups
- Select optimal building locations
- Assess storm and exposure risk
- Improve long-term energy independence
Suitable for
Turn invisible forces into usable power. With Swales.app, wind is no longer a guess — it becomes a measurable resource you can design with, plan around, and harness effectively.
Optimize your design with the Swales sun map and sun tracker tools. Visualize sunlight movement throughout the day and across seasons to position your home, garden, windows, and solar systems for maximum efficiency and comfort.
Sun tracker map
Follow the exact path of the sun across your land in real time
The sun tracker map shows the precise movement of the sun over your exact location — turning complex solar geometry into a clear, interactive visual tool for land, building, and energy design, from sunrise to sunset and across every season.
What you can see
- Real-time sun position (Live mode)
- Sun path from east to west across your land
- Sunrise, solar noon, and sunset positions
- Sun altitude and azimuth angles
- Seasonal sun movement across the year
- Daylight and night zones over your terrain
Why it matters
- Design passive solar buildings
- Orient homes, windows, and structures
- Optimize solar panel placement
- Plan gardens, orchards, and food forests
- Understand shade and microclimates on your land
Suitable for
Design with the sun, not against it. With Swales.app, you can see exactly how sunlight moves across your property — helping you place every structure, tree, and system in the most efficient and intelligent way possible.
Monitor rainfall patterns in real time with our live precipitation mapping system. Swales helps you better understand water availability, storm intensity, and seasonal rain behaviour for smarter land and water management.
Precipitation map
See live rainfall and storm intensity at your exact location
The precipitation map shows real-time rainfall conditions across your land — combining live weather data with your precise location to display rainfall intensity and storm patterns, so you can respond quickly to changing conditions on your property.
What you can see
- Live precipitation at your location
- Rain intensity levels (no rain to violent storms)
- Storm formation and movement patterns
- Rain distribution across your land area
- Real-time updates for fast decision-making
Why it matters
- Monitor storms and extreme weather events
- Protect livestock during heavy rainfall
- Plan farming and field operations
- Manage irrigation and water efficiency
- Prevent flood and erosion damage
- Understand real-time water input into your land
Rain intensity scale
Suitable for
Make every drop visible. With Swales.app, rainfall is no longer invisible data — you can see exactly how water moves through your environment, in real time, and make faster, safer, and smarter land decisions.
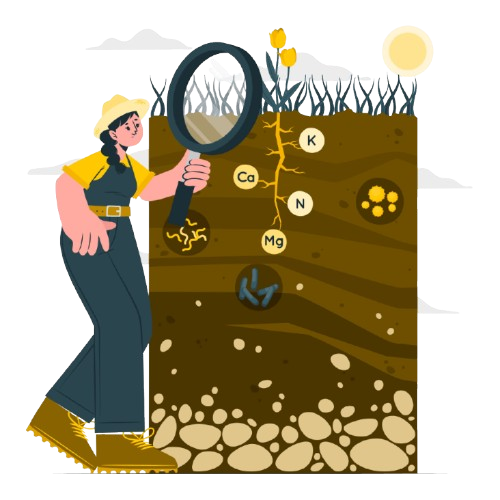
Access detailed environmental data through the Swales soil map. Explore soil characteristics based on your location to improve planting decisions, regenerative farming strategies, and long-term land productivity.
Soil map
Understand the foundation of your land before you design anything
The soil map reveals the hidden structure of your land — showing soil type, fertility indicators, texture, and nutrient balance directly at your location. It transforms complex soil science into a clear visual map that shows what your land can grow, how it behaves with water, and how it can be improved over time.
What you can see
- Soil classification by location (Cambisols, Luvisols, etc.)
- Soil fertility indicators (Nitrogen, Carbon Density, CEC)
- Soil texture balance (Clay, Sand, Silt)
- Soil pH level and acidity balance
- Soil composition distribution across regions
- Suitability signals for agriculture and planting
Why it matters
- Choose what crops and trees to plant
- Design food forests and permaculture systems
- Improve soil fertility and long-term productivity
- Understand water retention and drainage behaviour
- Reduce land development mistakes before investment
- Plan regenerative agriculture strategies
Suitable for
Build from the ground up. With Swales.app, you don't guess your soil — you understand it. Every design decision starts with the most important layer of all: the ground beneath your feet.
Visualize terrain height instantly using the Swales altitude map and elevation map tools. Understand landscape elevation, slopes, and terrain variation to support smarter planning and site analysis.
Altitude map
Understand how elevation shapes your land, climate, and productivity
The altitude map reveals the elevation profile of your location — showing how height above sea level influences temperature, water flow, crop suitability, and ecosystem behaviour. It turns raw elevation data into a clear visual system, from low valleys to high terrain.
What you can see
- Exact altitude (metres above sea level)
- Elevation zones across your region
- Terrain structure (valleys, slopes, high points)
- Climate influence based on elevation
- Geographic coordinates (latitude & longitude)
- UTM precision mapping for land analysis
Why it matters
- Understand local climate and temperature variation
- Choose suitable crops and vegetation types
- Plan livestock systems and grazing zones
- Design farms, homes, and infrastructure safely
- Predict frost risk and seasonal changes
- Improve water flow and drainage planning
Elevation zones
Suitable for
Elevation is climate intelligence. With Swales.app, altitude is not just a number — it's a key environmental signal that shapes everything from what you grow to how your land behaves over time.
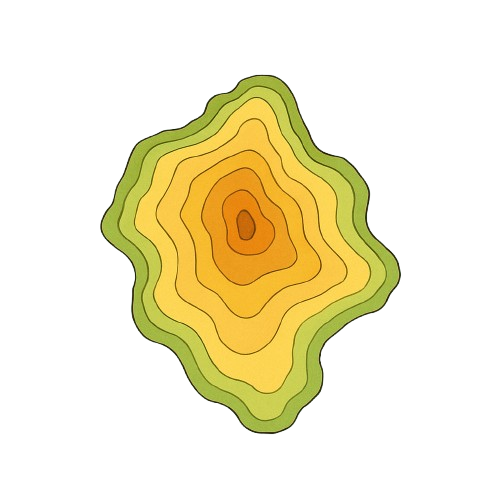
Generate a custom contour map for any location directly inside Swales. Analyse terrain shapes, water flow paths, and land formations to improve earthworks, water harvesting, and regenerative design planning.
Contour map
See the true shape of your land and how water moves through it
The contour map transforms elevation data into clear contour lines that reveal the real structure of your land — showing slopes, valleys, ridges, and natural water flow patterns. Instead of guessing how your land behaves, you can visually understand how gravity shapes every drop of water across your property.
What you can see
- Contour lines representing equal elevation
- Slope steepness and terrain gradients
- Valleys, ridges, and high points
- Water flow direction across your land
- Colour-coded elevation zones
- Custom contour resolution for different design needs
Why it matters
- Design swales, ponds, and water harvesting systems
- Prevent erosion and manage runoff
- Choose safe building and infrastructure locations
- Plan regenerative agriculture systems
- Understand natural water movement
- Optimise land design with precision
How it works
- 1Draw a rectangle around your location (max 10 km²)
- 2Set contour interval (default: 5 m)
- 3Adjust resolution: 1m, 2m, 5m, 10m, 20m, 50m, 100m
- 4Click Show Contour to generate the map
- 5Modify settings and regenerate instantly
- 6Hide or delete layers anytime for comparison
Suitable for
Work with the shape of the land. With Swales.app, contour lines become more than a map — they become a design tool that reveals how your land naturally wants to behave, so you can design with flow, not against it.
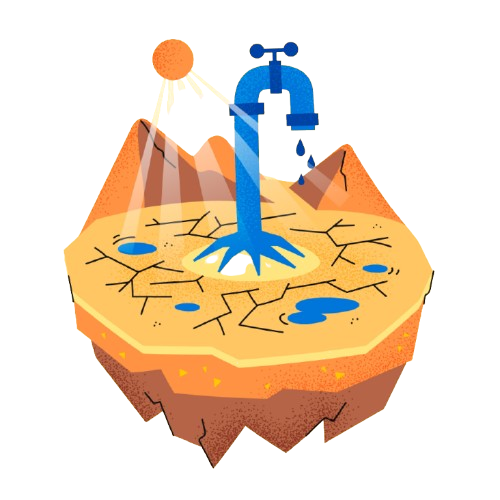
Identify environmental risks early with the Swales water stress map. Detect areas vulnerable to water shortages and understand long-term sustainability challenges before starting your project.
Water stress map
Understand how much water your land truly has
The water stress map shows how available or limited water resources are at your exact location — turning complex hydrological and climate data into a simple colour-coded map that instantly reveals your land's long-term water reality.
What you can see
- Water availability level by location
- Long-term water stress classification
- Regional water scarcity patterns
- Climate-based water demand balance
- Colour-coded risk zones across landscapes
Why it matters
- Choose crops and vegetation suited to your climate
- Design irrigation and water harvesting systems
- Plan regenerative agriculture and permaculture systems
- Assess drought risk before buying land
- Reduce long-term water dependency
- Improve resilience under climate change
Water stress levels
Suitable for
Water is the limiting factor. With Swales.app, you can see water stress before it becomes a problem — helping you design land systems that survive, adapt, and thrive even under changing climate conditions.
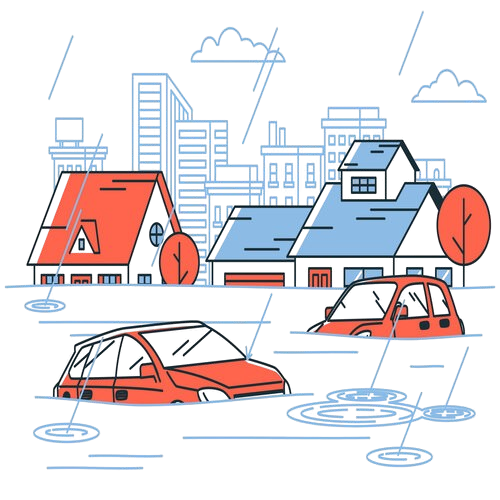
Simulate environmental risk using the Swales flood map and flooding map tools. Understand how water may move across your land during heavy rainfall and plan safer, more resilient designs.
Flood risk map
See how rising water levels affect your land and the world
The flood risk map simulates how different water levels impact your exact location and the entire globe — helping you understand which areas stay safe and which become vulnerable to flooding. Adjust a simple water level input and visualise real-world and extreme flood scenarios instantly.
What you can see
- Global flood simulation based on elevation
- Local flood impact at your exact location
- Areas submerged at different water levels
- Safe elevation zones and high-ground areas
- River basins, coastal flooding, and lowlands impact
Why it matters
- Evaluate land before buying or building
- Identify safe zones for homes and infrastructure
- Design flood-resilient farms and landscapes
- Plan drainage, swales, and water management systems
- Understand climate change and sea level rise risks
- Protect livestock, crops, and property
Water level simulation
Suitable for
Design with water, not against it. With Swales.app, flood risk becomes visible before it becomes a problem — helping you build safer, smarter, and more resilient land systems for the future.
Stay connected to live environmental conditions with the Swales weather map. Access real-time temperatures and a 3-day forecast based on your location to support better planning and outdoor decision-making.
Weather map
Real-time weather conditions and short-term forecast for your exact location
The weather map shows live atmospheric conditions and a 3-day forecast for your specific location — turning local climate data into a clear, simple view so you can plan daily activities, farm operations, and land management with confidence.
What you can see
- Current temperature at your location
- Real-time weather condition (sun, clouds, rain, etc.)
- 3-day temperature forecast
- Daily weather changes and trends
- Location-based climate updates
Why it matters
- Plan farming and irrigation activities
- Protect crops from sudden weather changes
- Manage livestock comfort and safety
- Schedule construction and outdoor work
- Optimise solar and wind energy usage
- Understand short-term climate behaviour
Example forecast
Suitable for
Stay ahead of changing conditions. With Swales.app, weather is no longer unpredictable — it becomes a clear, actionable layer of intelligence that helps you make better decisions every day.